
Open-circuit voltage (OCV) rises with sulfuric acid molality (m). A widely used fit (25 °C) is:
$$ OCV = 1.9228 + 0.147519\log(m) + 0.063552\log^2(m) + 0.073772\log^3(m) + 0.033612\log^4(m)\quad [\mathrm{V/cell}] $$
Because float voltage clamps terminal voltage, it indirectly caps the maximum acid concentration achievable in service.
For a uniform electrolyte path of effective length (L), cross-section (A), resistivity (\rho), and specific conductivity (g = 1/\rho):
In porous electrodes (VRLA), the effective area/geometry makes (G) scale with the amount and concentration of electrolyte. A convenient proportional form is:
$$ G \propto g \times \frac{V}{L^2} $$
where (V) is electrolyte volume. When we normalize to the new state and track how concentration (affecting (g)) and quantity (affecting (V)) change, we obtain an electrolyte conductance ratio:
$$ \frac{G_d}{G_n} \approx \left(\frac{g_d}{g_n}\right)\left(\frac{B_d}{B_n}\right)\left(\frac{D_n}{D_d}\right) $$
Here (B) is electrolyte mass and (D) is density; this form captures how losing water or acid shifts both (g) and the total electrolyte present.
By conserving how much acid and how much water the cell can have relative to new, and by enforcing the float-limited maximum concentration, one obtains an upper envelope: the highest capacity possible for a given conductance ratio. Intuitively:
Once the electrolyte sits at the float-limited concentration, mass-balance links additional water loss to acid precipitation as PbSO(_4) and to a nearly linear relation between the two ratios:
$$ \frac{Ah_d}{Ah_n} \approx k \cdot \frac{G_d}{G_n}\quad\text{(dry-out lower bound)} $$
where (k) is a constant calculated from the new-state density, the float-limited density, and specific conductivities. In practical terms: as conductance drops further in dry-out, capacity must drop proportionally along (or above) this line—never below.
Field rule of thumb: Below ~60% conductance ((G_d/G_n < 0.6)), the combined electrolyte + plate constraints force (Ah_d/Ah_n < 1.0) (i.e., capacity <100%), and in service datasets it is very often <80%.
Theoretical active material per 1 Ah (before utilization factors):
Because sulfation consumes active surfaces and blocks pores, plate-limited capacity gives additional upper/lower bounds that can dominate when plate loss or hard sulfate is severe—even if electrolyte looks “acceptable.”
By separating electrolyte and plate effects and enforcing mass/voltage constraints, we get hard boundaries between normalized conductance and capacity in VRLA batteries. Practically:
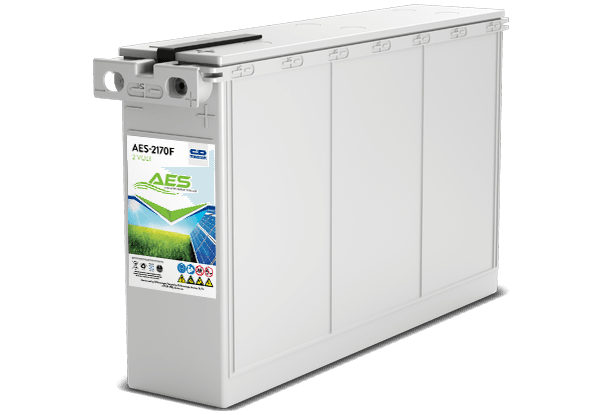
Advanced Energy Storage Nano-Carbon AGM Battery
Designed for grid-tied and off-grid energy applications requiring back-up power C&D’s Advanced Energy Storage (AES) battery line meets the demanding standards of applications that may face extreme temperature, shock, or vibration. Enhanced features such as a rugged case, Deep Cycle Series (DCS) Technology, and Advanced Nano-Carbon® technology make the AES an ideal choice for renewable energy applications, Battery Energy Storage Systems (BESS), or any application that calls for repetitive cycling.
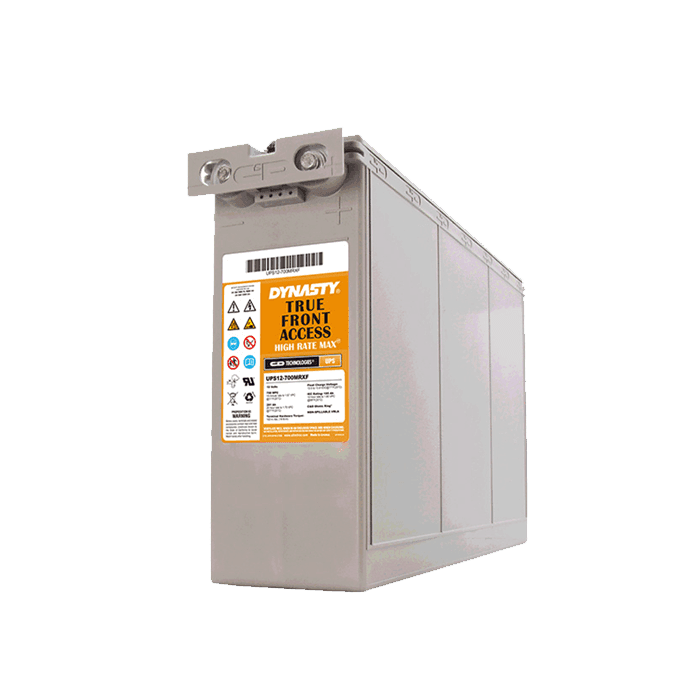
High Rate MRXF Series
True front access, high-rate power , Optimized UPS Configuration , Valve Regulated Lead Acid (VRLA) Battery Series Design For UPS Standby Power Applications
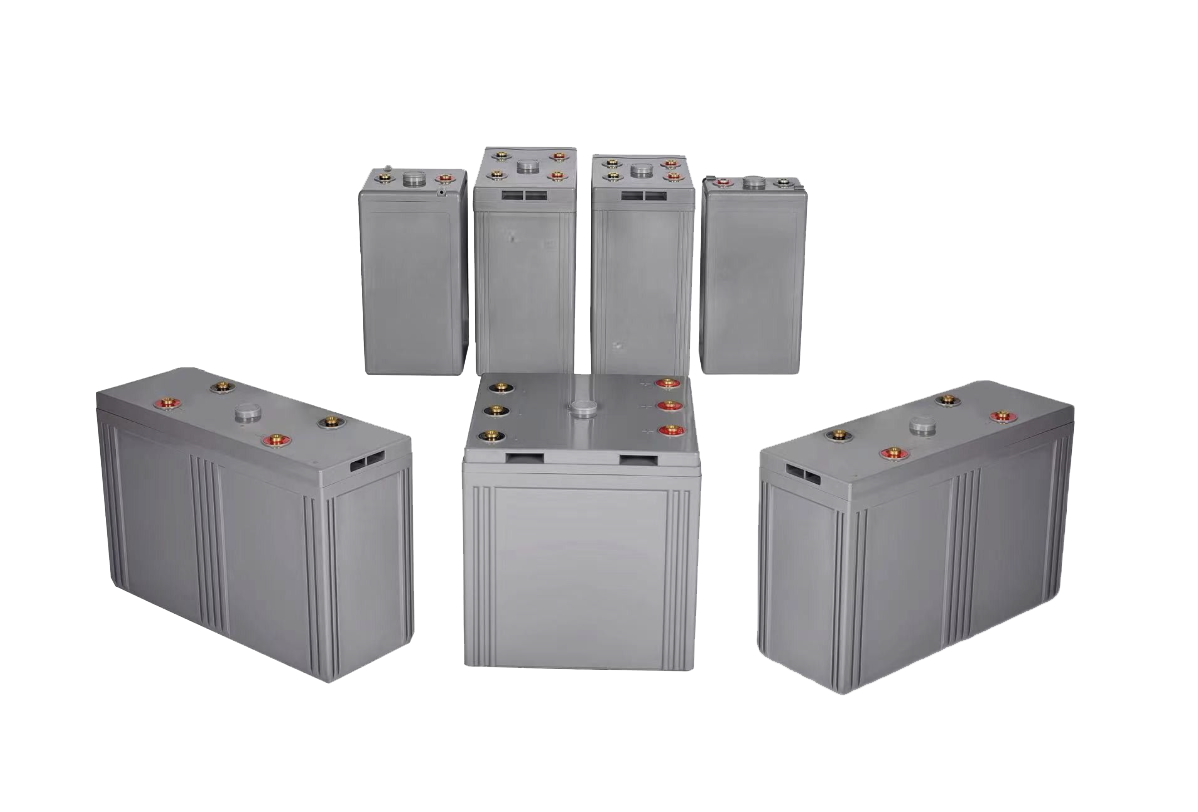
LBTY 2V Series
Wider range and higher capacity , Valve Regulated Lead Acid Battery For Standby Power Applications
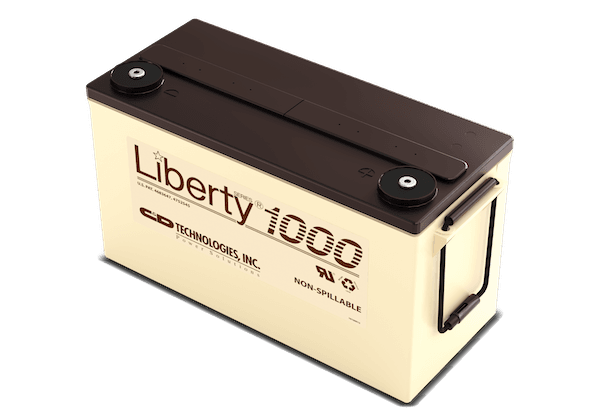
Liberty 1000 Lead Calcium AGM Battery
Liberty 1000 Lead-Calcium batteries offer long battery life with minimal maintenance due to C&D's patented processes. C&D Technologies manufactures these valve regulated lead-calcium AGM batteries for standby applications. Liberty 1000 stationary batteries fit virtually anywhere while providing superior performance in the most demanding applications.
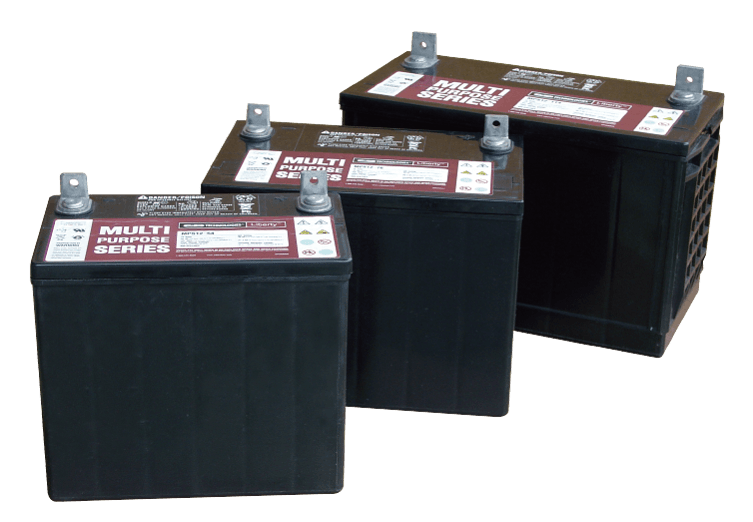
MPS Series
Reliable and longer life , Reliability & Best Value for Money , Valve Regulated Lead Acid Battery For Standby Power Applications
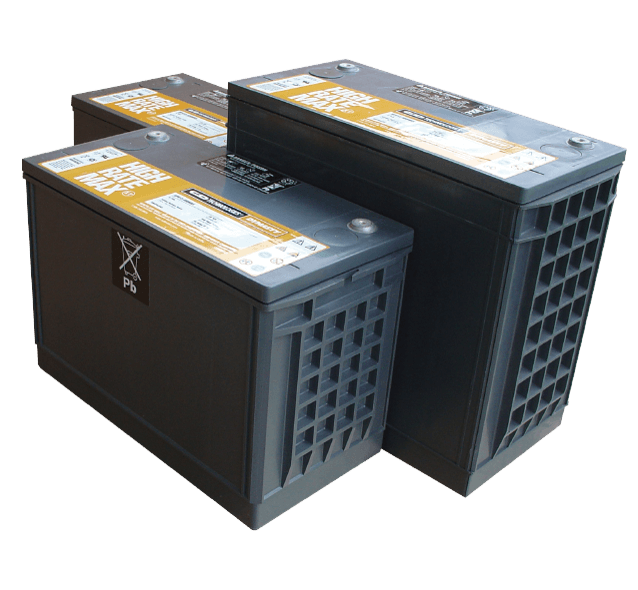
MRX Series
High Rate Max XT, next generation of original Dynasty , Valve Regulated Lead Acid Battery Designed for UPS Standby Power Applications
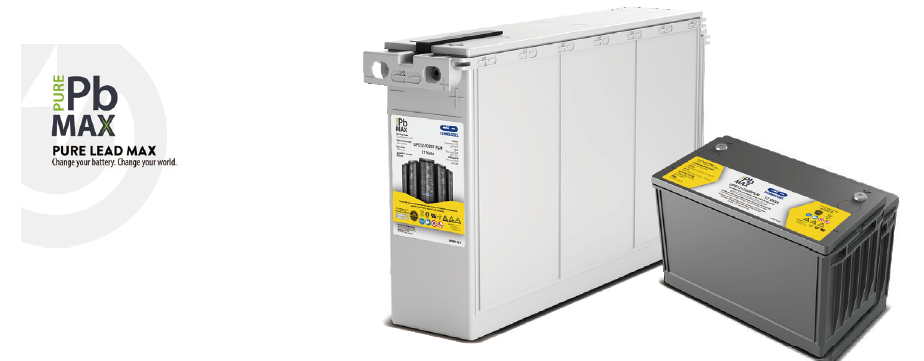
Pure Lead Max AGM Battery for UPS (China)
Premium battery for UPS & data centers with super-long life, extreme high-rate, ultra-low float current and excellent high-temperature performance.7y warranty @25°CC&D’s longest lasting VRLA battery for UPS systems and offers a single-replacement which helps to reduce total cost of ownership. Helps to reduce power consumption and support sustainability initiative thanks to its ultra-low float current as well as excellent high-temperature performance.
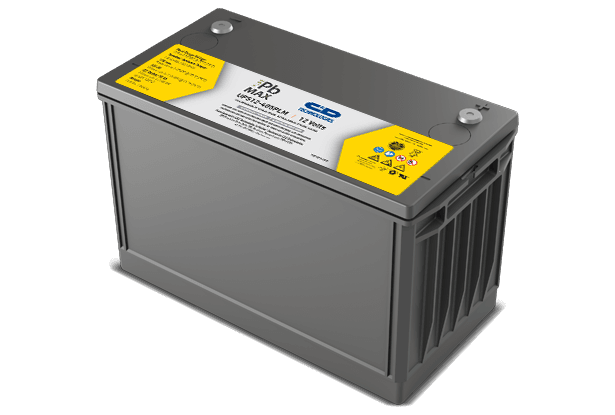
Pure Lead Max AGM Battery for UPS (USA)
Pure Lead Max Batteries are C&D’s longest lasting VRLA batteries for UPS systems. This pure lead AGM battery is backed by an industry-leading 8-year warranty. Thanks to patented pure lead alloy and catalyst technology, this pure lead AGM battery can reduce total cost of ownership by offering a sustainable, single-replacement for a 15-year UPS system. The safe choice for your data center battery backup needs.
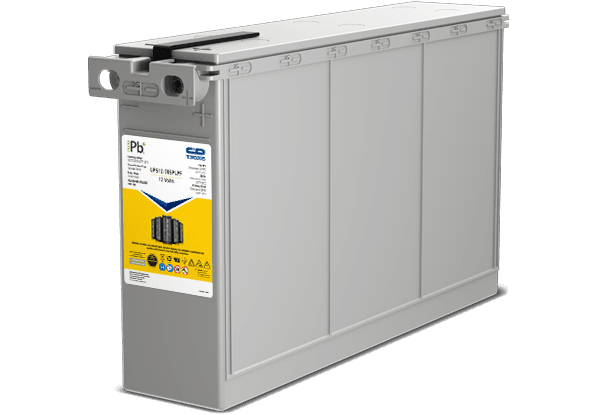
Pure Lead Plus AGM Battery for UPS (China)
For extra high-rate application, especially 5min backup Designed with pure lead technology for extra high-rate application with long life and stable performance Super low float current, which significantly increase the battery operation life, especially at high temperature.
Pure Lead Plus AGM Battery for UPS (USA)
C&D Pure Lead Plus UPS batteries feature the safe and sustainable design of VRLA. Thanks to proprietary paste and grid technology, our Pure Lead Plus batteries reduce your replacement costs by up to 40% and have a 2-year shelf life operating at higher ambient temperatures. The Pure Lead Plus line is the smart choice for your data center backup needs.
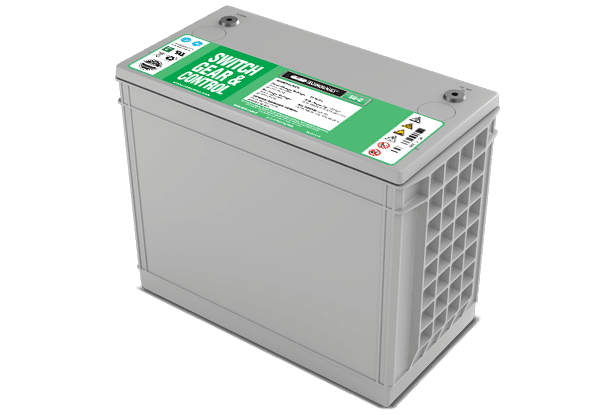
Switchgear & Control Series AGM Battery
Extensive life cycle testing ensures the longest and most reliable service life possible C&D Technologies Switchgear & Control Series AGM Battery (SGC series) provide standby power in Switchgear & Control applications. SGC stationary batteries are powering energy & infrastructure projects including battery change-out trucks, electric utility substations, telephone backup, microwave sites, signaling sites, offshore platforms, and more.
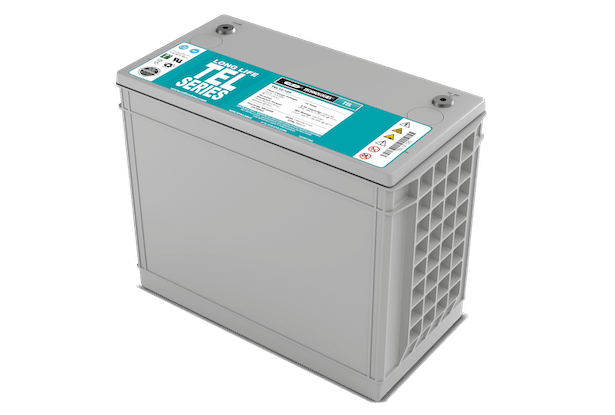
TEL Long Duration Series AGM Battery
Telcordia certified life exceeding 10 years. C&D Technologies TEL Long Duration series batteries are designed to provide standby power to critical applications in the Telecom industry. The batteries in this long duration series are Telcordia-tested, qualified to meet superior standards on extensive life cycles, and ensure the longest and most reliable service life possible.
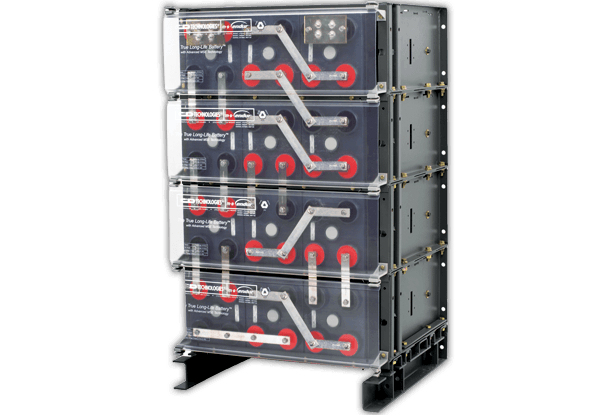
msEndur II Pure Lead AGM Battery
The original high-temperature-capable VRLA battery C&D’s msEndur II AGM Pure Lead battery is the most advanced 2V VRLA solution for Telecom, UPS, and Utility applications. As the original high-temperature-capable VRLA battery, it brings decades of proven field performance. By combining the service life reliability of a flooded battery with the performance energy density of a valve-regulated battery, the msEndur is the True Long-Life Battery™ for controlled and uncontrolled environments.
Our engineers are ready to help you find the right power solution.
